Rain Dance in the Middle of a Flood: Selling Upzoning With A False Narrative of “Underproduction”
YIMBY theory advocates giving developers free reign to alleviate an alleged “housing production gap”.
We examine whether Bozeman shows evidence of such “underproduction”.
Bozeman and Gallatin County show little evidence of “underproduction” in aggregate.
To the extent the market is producing a superabundance of luxury housing and insufficient affordable and commodity housing, the obvious solution is to use regulation to cross-subsidize the desired tier of housing out of supernormal profits from luxury development.
The YIMBY theory of causation of housing affordability goes something like this: housing prices are high due to inadequate supply. Inadequate supply is a consequence of “underproduction”. And underproduction results from excessively tight zoning regulations. We want to focus briefly on the middle step of the syllogism, specifically as regards Bozeman and the surrounding area. Has Bozeman suffered from “underproduction”?
Proponents of the “underproduction” story often cite the annual “Housing Unproduction in the U.S.” report put out by well-funded national YIMBY organization “Up For Growth”.* Their methodology involves looking using census data to determine what household formation in each jurisdiction ought to have been and comparing it to housing unit production. Obviously, “ought-to-have-formed” households are not directly observable. Instead, this methodology looks for suppressed household formation by comparing household headship rates over time. If adult children can’t leave home, if roommates are forced to live together longer, if families double up, the ratio of householders and spouses/partners of householders to the total number of adults will fall.
While this is a crude measure, one that is open to many valid criticisms, we will accept arguendo the YIMBY contention that it represents a reasonable measure of underproduction.** Later on in this analysis, we will also look at some other related metrics. The important point to keep in mind is that if no production gap can be found for a jurisdiction, the YIMBY case falls apart. Housing stress must be coming from some other source.
First, for context, we will look at the raw per-capita production rate of Bozeman and Gallatin County. Over the 2014-2024 period, Gallatin County produced new housing units at an annualized per capita rate of 15.4 units per thousand existing residents per year. Bozeman City produced 17.8 housing units per thousand residents. To put that in context, Gallatin County came in 45th out of 3,073 US counties for which data was available. Bozeman City came in 69th out of 6,501 census places with at least 20,000 population. In short, Bozeman City and Gallatin Counties are in absolute terms national champions in per capita housing product. The few places that score higher than Bozeman tend to be sprawling satellite jurisdictions of bigger cities, which have the benefit of calling on a larger metro for construction resources, capital and resident flows. For example, Georgetown, TX, a bedroom community of Austin. Acknowledged “NIMBY strongholds” like New York City, Long Island, and the Bay Area produce housing at a fraction of Bozeman’s rate. Bozeman beats celebrated high-production areas like Cape Coral, Florida and Austin, TX and absolutely creams “zoning reform leaders” like Minneapolis and Portland.
—————————————————————
* Among the biggest sponsors of UFG’s latest report: AirBNB, The National Association of Realtors, Equity Residential (a large developer of luxury apartments), Holland Partners (developer), Trammel Crow (another developer), and Vitus (an affordable housing developer).
** The biggest issue with relying on this metric as dispositive proof of underproduction is that it ignores the potential for labor-market issues to generate the same patterns. If the labor market does not provide net new jobs that pay a sufficient wage to cover the cost (whether in mortgage or rent) of a new housing unit, the market will not produce new housing in quantity sufficient for all potential newly formed households, even in the absence of regulatory barriers to housing construction. This is almost precisely what played out when the government of Mexico attempted to close an alleged “housing gap” in the early 2000s with production and financing incentives. A huge percentage of the newly built homes quickly went into default and foreclosure.

We need to remember, however, that the standard analysis of underproduction begins with overall production but also considers a sort of normalized or adjusted measure of household growth/formation. That said, there are physical limits to production, particularly in a jurisdiction like Bozeman that cannot call on the resources of a larger metro. Even if household formation proves very high, it might be inappropriate to blame production restrictions for a mismatch in the context of a production rate that is among the very highest of any jurisdiction in the US! Luckily, we need not consider that question very closely, because, as we will see, a comparison of household formation and housing production still does not show a pattern of underproduction.
We will look first at Gallatin County, because the Census Bureau’s American Community Survey produces annual estimates for the county, but only rolling five-year estimates for the city. The first comparison is to look at the change in the number of households versus the change in the number of housing units. Our base year is 2015, and we look at the change from that year to three horizons: 2019, 2022, and 2024.
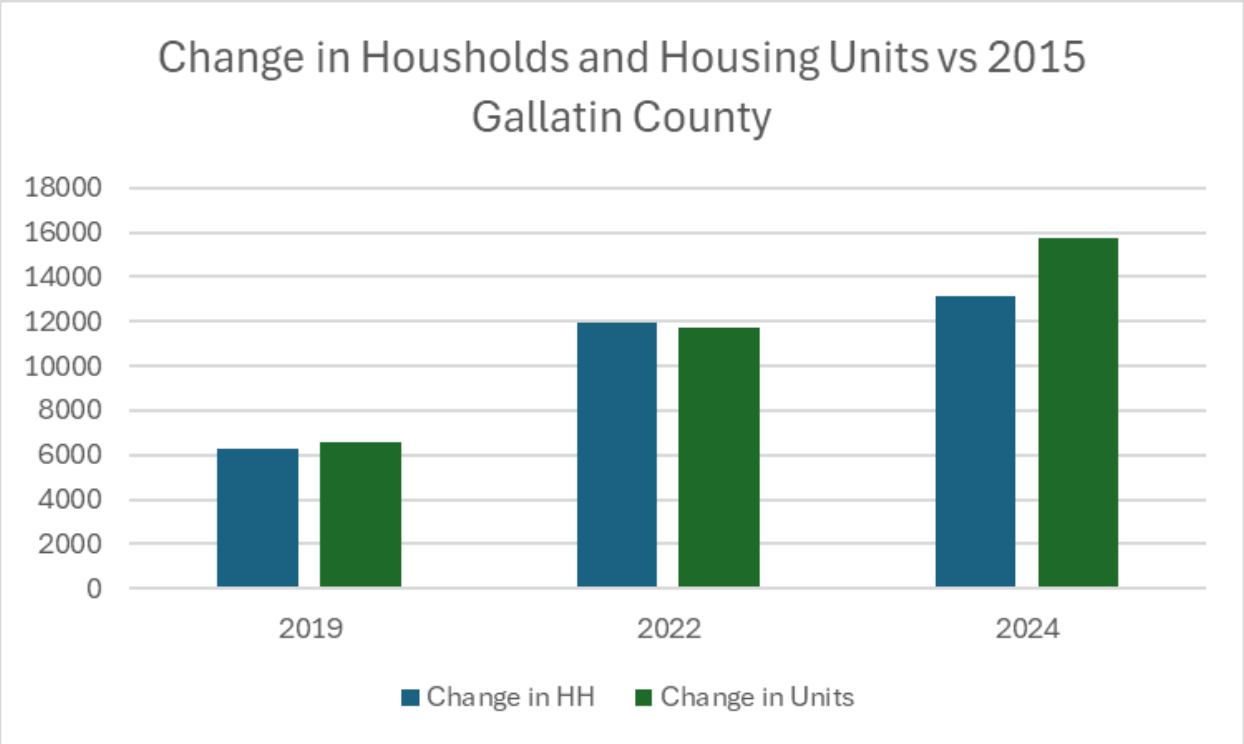
Hold on! Over the entire 2015-2024 period, housing unit production has outstripped the increase in households! Not exactly what one would expect if one has taken YIMBY claims about underproduction seriously. However, this does jibe with reports about recent sharp increases in multifamily vacancy rates in our area.

In addition, the construction of many seasonal homes in the Big Sky area may boost the housing unit count without a concomitant increase in resident households. It is therefore important to drill down further and look at other metrics that might detect whether this apparent excess production is a mere artifact of second-home production.
Even though a cursory look at the high-level production and household count data strongly undercuts the narrative of a production shortfall, we will see it even more clearly through the rest of the analysis, namely the attempt to detect “hidden” household growth. The standard way to look for “hidden households” is to measure changes in headship rates. Under Census rules, each household is assigned one “head.” The analytical approach assumes that a head of household, the head’s spouse or partner, and any minor children represent a natural household. Adult children, other relatives, or unrelated persons are potentially members of households that may have failed to form due to lack of housing availability. Obviously, many people form multigenerational households by choice; likewise having roommates while in school or in early career is quite standard. Therefore, it is not assumed that people other than heads, spouses/partners, and minor children would all form new households given extremely cheap housing. Instead, the methodology takes the headship rate of a base year as an anchor and then considers changes in headship as an indicator of suppressed household formation. So how does Gallatin County look on this score?

Headship rates have barely moved over the last decade, but it is worth noting that at 76%, 2024’s headship rate is the highest of the period. Again, no indication of an increase in suppressed households. Underproduction? Not in evidence.
Unlike our YIMBY friends, we try to avoid motivated reasoning. In that spirit, we decided to look at two other metrics that might reflect housing underproduction. First, we consider the ratio of adults to housing units, which represents another way of seeing “crowding” associated with housing underproduction.***
Second, we consider the number of adults per occupied housing unit. Both demonstrated in the graph below. Now, clearly not every unoccupied housing unit represents a vacation/seasonal home or STR. But we recognize that new construction of vacation homes and STRs should not count the same as regular housing units. By looking at adults per occupied household, we should be able to detect a situation where the apparently robust housing unit addition is merely an artifact of a booming second-home and/or STR market. An increase in the ratio of adults to occupied housing units would not in itself prove underproduction – it might reflect a mismatch of luxury housing production vs formation of middle or low-income families – but it still would raise questions. So how does Gallatin County look?
————————————————————-
***The difference between adults-per-household and headship rates is subtle. The biggest difference is in married/domestic partner households. The headship metric excludes spouses/partners from the denominator of the “heads-to-total-adults” ratio. Adults-per-household considers spouses and partners. In theory, a symptom of an undersupplied market could be a higher propensity for cohabitation or even marriage for economic (household consolidation) reasons. Adults-per-household would pick this up, while headship rates might not. For example, assume a sample of 10 occupied households, 8 of which consist of married couples and two of which consist of individuals, in a relationship with each other. The headship rate is 100%. Adults per household is 1.8, as is adults-per-occupied-household. Now the two individuals decide to cohabit for economic reasons. Headship rate remains 100%, adults-per-household remains at 1.8, but adults-per-occupied-household increases to 2.0.

Again, no meaningful change. The 2024 ratio comes out lower than in 2015, on both metrics. So to recap, we see no shortfall in housing unit production relative to change in households, no evidence of involuntary household combination visible in headship rates, and no change in adults per household, whether measuring against all households or just occupied households. A final approach proceeds from the assumption – one which YIMBY’s still implicitly rely on in much of their analysis, even though in the post-COVID, remote-work world it probably no longer holds for most places – that housing demand is driven primarily by economic opportunity. That is, residential demand follows jobs.****
We therefore propose to examine several job-related statistics. We use as our source of jobs data the Longitudinal Employer-Household Dynamics dataset published by the Census, based on BLS administrative data (that is, it is a data set based on administrative filing, in this case tax withholding and unemployment insurance, and not on extrapolation from a survey sample). The latest data available from LEHD is 2022. First we look at the ratio of jobs to both metrics of housing units (total units and occupied units). In the context of underproduction, and assuming that jobs drive residential demand, we should see a large increase in the ratio of jobs to housing units. What do the data tell us?
———————————————————————
**** With the rise of remote work, many more internal migrants are able to choose their destination based on amenities rather than economic opportunity. In addition, the increase in the over-65 population leads to a decline in the labor force participation rate. Wealthy retirees can choose where to live free of job-market concerns. Yet, most YIMBYs refuse to acknowledge the greater detachment of labor market from housing market and its consequences. With respect to an increase in retirees, we do see some evidence of this in Gallatin County, with the percentage of households headed by someone over 65 years old increasing from 11% in 2015 to 13% in 2024. For the City (from 2015 5-year rolling to 2023 5-year rolling) it increased from 13.1% to 16.3%.

Once again, we don’t see a trend. Jobs-to-total-housing-units increased from 2015 to 2019, but fell by 2022. The differences are small. When considering only occupied housing units, we see almost identical rates in 2015 and 2022. Finally, we consider two supplementary metrics: the percentage of jobholders working in the jurisdiction who also live there (bearing in mind that remote work can distort this in an administrative data set; remote workers often have recorded places of work hundreds or even thousands of miles away); and the percentage of workers with a commute of under ten miles. If housing is underproduced relative to the demand generated by the job market, we should expect a plunge in the percentage of locally-dwelling jobholders and a reduction in the percentage of workers with short-distance commutes.

The data show a small decline in both statistics, some of which probably represents an increase in remote work. Also, with an increase in jobs outside of Bozeman, more jobs have arisen near the borders with other counties. We see no evidence here of a meaningful mismatch between job creation and housing production.
Now, we consider each of these measurements for the City of Bozeman. We note again that the Census Bureau only publishes 5-year rolling estimates for the city (due to the smaller population and sample size relative to the county). Therefore, the numbers are not directly comparable to those for the County. In addition, the latest year available for 5-year rolling estimates is 2023. To align the jobs data (which is annual) with the Census data, we use the job year two years prior to the end of the 5-year rolling Census period.
First, we look at the change in households and housing units relative to the 2015 (5-year rolling) base period:

We see an almost identical change in each quantity. We don’t see the large excess of housing units additions that we do at the county level, but we note that the number of vacant units did not change appreciably over the period and point out again that the 5-year rolling period excludes 2024 and deweights 2023 relative to years of lower production (including the 2020 COVID supply-chain disruption). Verdict: no sign of underproduction at this high level.
We move on to examining whether headship rate changes tell a different story.

Headship rates actually increased slightly over the period. We see no evidence from headship rate to contradict the high-level story of matched housing unit and household growth at the level of the city.
Now we consider our measures of the ratio of adults to housing units (occupied and total).

We see a very small increase on both metrics, but, like the decrease we saw at the level of the County, not a change with any real significance.
Finally, we look at the jobs-based metrics.

Over the course of the period of interest, the both jobs-to-housing units ratios fell, the opposite of what YIMBY theory on underproduction predicts.***** Likewise for the percentage of city jobholders living in the city and the percentage of jobholders with a short commute. Both of these increased very slightly over the course of the study period.
—————————————————————
***** How much of this reduction could be an artifact of increasing share of population being over-65? Labor force participation for over 65s is around 20%. Prime-age is around 80%. Assume that none of the households with an over-65 head have an under-65 partner. Given adults per household of 1.7, in this crude model, when a household goes from prime-age-headed to over-65 headed we go from 1.75* 0.8 jobs to 1.75 * 0.2 jobs, for a loss of 1.05 jobs. Overall 57% of Bozeman employed residents have a job in Bozeman, according to LEHD data. So that means 1.05 * 0.57 = 0.6 jobs. A 3.1pp increase in over-65-headed households would mean a “loss” of 1.7% in local jobs held by locals. Naively, that would increase the 2023 jobs-to-occupied households from 1.75 to 1.78, which is flat to the 2015 level. Verdict: retirees don’t change the picture.

The data are very clear. Neither Bozeman nor Gallatin County exhibit any of the symptoms of “underproduction.” Without evidence of underproduction, the rationale for upzoning Bozeman falls apart. You can’t raise the speed limit on the Autobahn, so to speak. The cars are already moving as fast as they care to go. What is the likely consequence of the proposed upzoning via the new UDC? Not more production, but rather an ability of developers to modestly pad profits by ignoring externalities to neighbors and neighborhoods that would otherwise rightly be controlled or mitigated by zoning.
On the other hand, we do have many residents suffering from housing affordability challenges. So, what does the conjunction of very robust production and housing-cost-burdened households tell us? The most economical explanation is that we have a production mismatch.
Development of luxury units remains profitable (though with the current multifamily vacancy rate, let’s see for how long; 2025 permitting levels have fallen from the 2022-2024 peaks), so developers want to build more of it even into weakening demand. Affordable or even commodity housing cannot compete on profitability, developers don’t care to build it. What’s the solution to that problem? Or at least, how can regulatory levers be used to mitigate it?
A full consideration of that question is beyond the scope of this piece. However, at a very high level this seems like the perfect use case for inclusionary zoning. The knock on IZ is that the burden it places on developers reduces profitability and therefore will reduce, at least to some extent, production levels. But guess what, Bozeman can afford lower production levels in aggregate if it gets higher production of non-luxury units. And that is precisely what IZ does.****** That the well-funded YIMBY agents sent into our community by their coastal paymasters oppose an inclusionary zoning-type initiative like WARD tells you all you need to know about their lack of sincerity. WARD increases the exaction on profitable high-density development – the very sort of development that appears to be in oversupply – and redirects the resources to guarantee the provision of the affordable housing that seems to be scarce. Anyone who both cares about housing affordability and can look at data with an open mind should be able to see this. Unfortunately, our local YIMBY leaders are well paid to keep their followers blind.
We would encourage those with a genuine concern about housing cost issues in Bozeman to investigate these sorts of regulatory approaches more carefully. Unfortunately, at the moment most of the effort is going into a fight over the prescription for an incorrect diagnosis.
———————————————————————
****** See Wang and Fu (2022) for a good review of prior work on the effect of IZ on market rate and affordable housing production and a new analysis of a large dataset of IZ programs.